WinCT-Viscosity
Via RS232C, this software enables A&D’s Sine-wave Vibro Viscometer SV Series to display the progress of measurement in real time on a PC or easily transmit the measured results (data) to save or analyze. The CD-ROM of WinCT-Viscometer is equipped as a standard accessory of Viscometer SV Series.
RsVisco: Graphing software to create graphs of the measured results and the progress of viscosity measurement.
1. Creates the real-time graph of data received from A&D’s Sine-wave Vibro Viscometer SV Series via RS-232C. Progress of change in viscosity during measurement can be monitored in a graph. Temperature data also can be simultaneously displayed, and the graph of temperature and viscosity can be monitored in real time.
2. The following three types of graphs are provided to choose from; Viscosity (Y axis) – Time (X axis), Viscosity/Temperature (Y axis) – Time (X axis), Viscosity (Y axis) – Temperature (X axis)
3. Graphs can be overlaid in repeating measurements. (in 10 colors)
4. Measured data can be saved in a CSV format file.
5. Displayed graph can be printed with a printer via a PC.
WinCT-Viscosity
Example 1- RsVisco Display
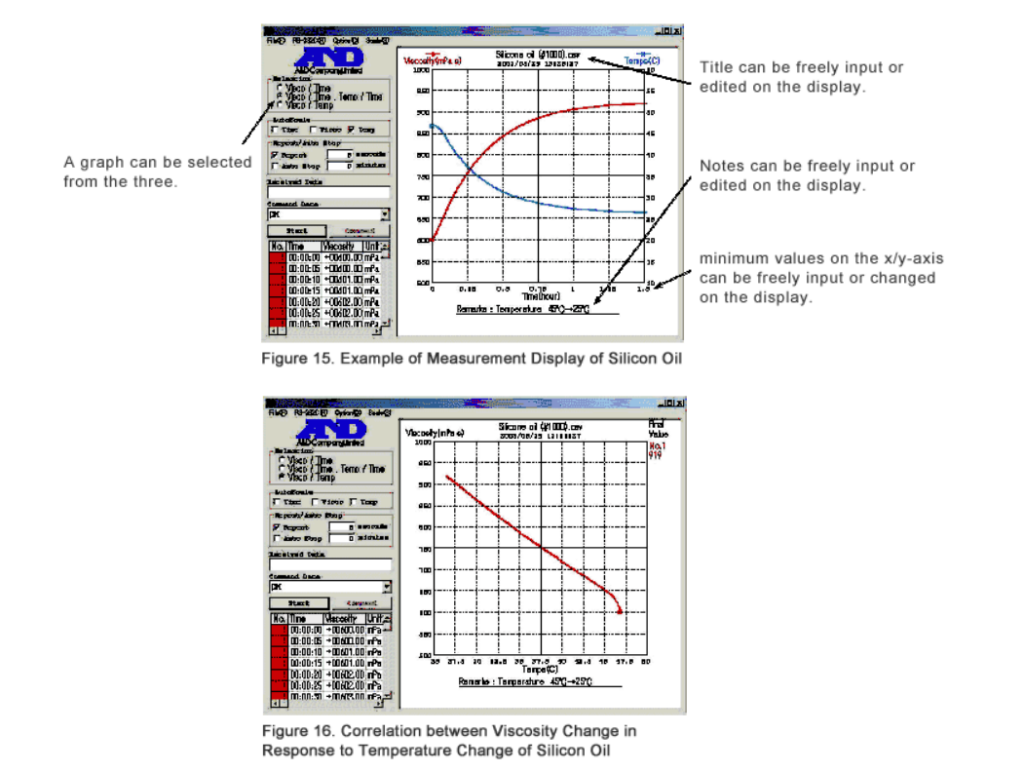
RsVisco is software to read the measured results (CSV file) and create a graph representing the measuring viscosity in real-time as shown in the figures below. Figures 15 and 16 show the graphs representing viscosity changes of silicon oil (Newtonian fluid) measured at room temperature while leaving it cooling down from about 45°C to 25°C. In Figure 15, the graph shows the elapsed time plotted along the x-axis and the viscosity (left) and the temperature (right) plotted along the y-axis. In Figure 16, the same data is represented by plotting the temperature along the x-axis and the viscosity along the y-axis. The linearity of the correlation between the changes in viscosity in response to the changes in temperature is well presented.

Example 2 – Viscosity Measurement of Water-based Paint
Figure 17 shows the graph representing the measured result of a water-based varnish at room temperature under the fixed condition. This sample shows a stable viscosity despite the elapsed time. Figure 18 represents the measured result of a water-based paint (black) at room temperature under the fixed condition.
After starting the measurement, this sample shows a tendency of gradually decreasing (thixotropy). To evaluate the viscosity of a sample as this, for instance, we will find the time when the decreasing tendency becomes slow experimentally. We can evaluate the viscosity value from the time.
Example 3 – Viscosity Measurement of Food
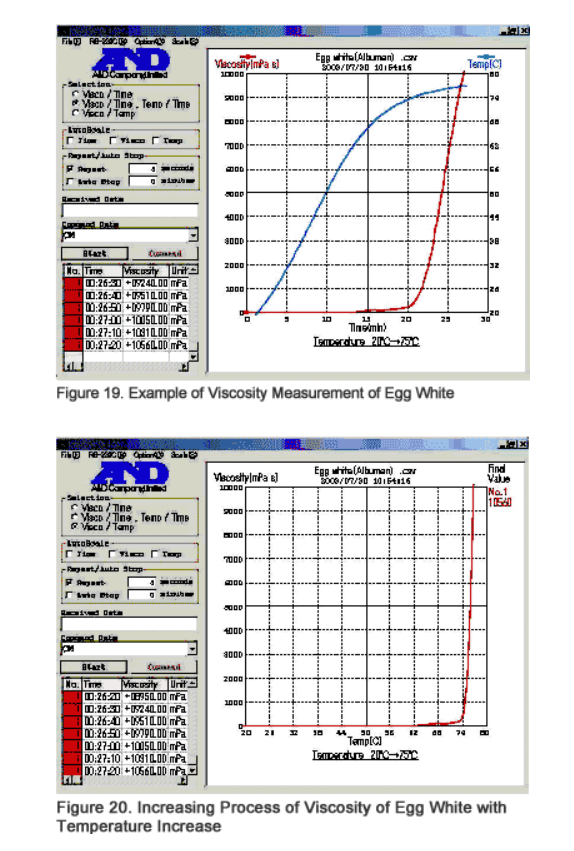
Figures 19 and 20 show the graphs representing the measured results of the viscosity of egg white while heating it with a heater from room temperature to about 80°C. The behavior of egg white rapidly coagulating over 60°C is measured well. The graphs precisely show the properties of protein (albumin), which is the main component (composition) of egg white.
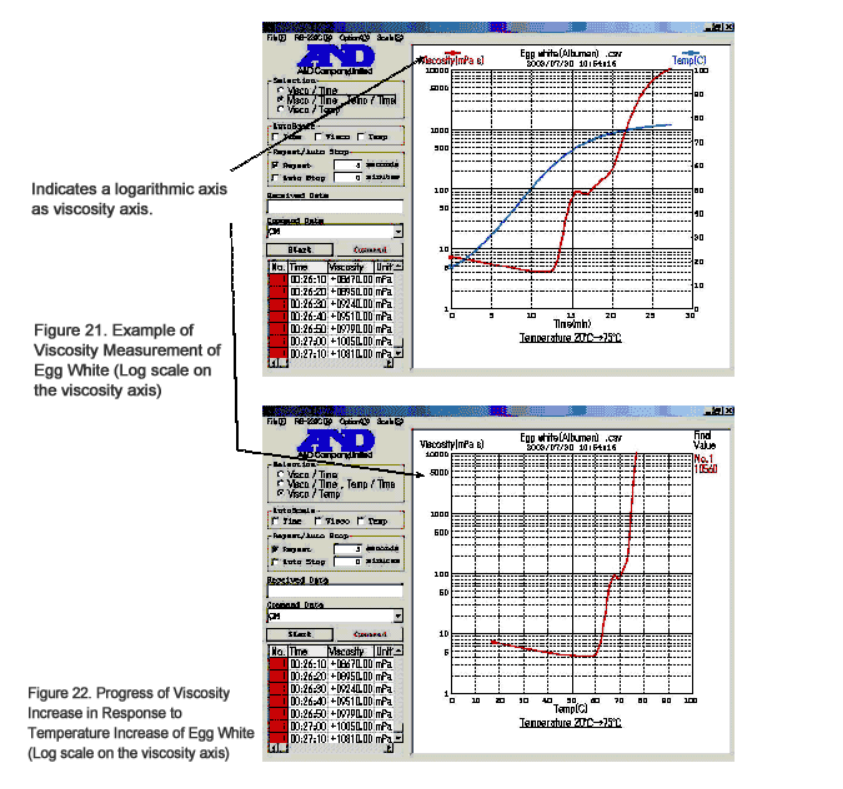
Figures 21 and 22 show the graphs representing the measured results of the viscosity of egg white, shown in Figures 19 and 20, by indicating with logarithmic scale on the y-axes (viscosity). We can observe, especially in Figure 22, that when the temperature was 60°C or lower the viscosity of egg white decreased as the temperature increased, like a common liquid does, but once it surpassed 60°C, the viscosity increased rapidly as its protein coagulated. The vibro viscometer SV Series can capture precise dynamic changes in viscosity as well as small changes peculiar to a sample (matter).
As you can see, WinCT-Viscosity (RsVisco) can indicate a logarithmic axis on the viscosity axis so as to clearly present the changes in viscosity of a wide range or of non-linearity.
Figure 23 shows an example of viscosity measurement of 2.5%(green line) and 5%(red line) gelatin solutions while varying the temperatures. The temperature is plotted along the x-axis and the viscosity along y-axis (log). We can observe that the coagulation point depends on the concentration of the solution.

Figure 24 is the graph representing the measured result of custard pudding at approx. 20°C. Four samples (3 good samples and 1 failure sample) were measured. The upper three lines (red, light blue and light green) are of good samples and the lower line (purple) is of the sample, which was evaluated as a failure. As we can see, the evaluation made based on one’s experience is now possible to present with values by measuring the viscosity with SV-10.
Figure 25 shows the graph representing the measured result of Worcester sauce under the fixed condition (room temperature).
We can see the SV-10 measurement presents that Worcester sauce shows a stable viscosity in response to the elapsed time.